How to Use a Stainless Steel Plate Grade Chart for Material Selection
Struggling to pick the right stainless steel from countless options? A wrong choice leads to project delays, budget overruns, and even catastrophic failures. A grade chart simplifies this complex decision.
To use a stainless steel grade chart effectively, first understand its strategic purpose. Then, identify your application's key properties, locate and interpret the relevant grades, compare them on specific criteria, and finally, make an informed, data-driven selection for your project.

Choosing the correct material is one of the most critical decisions in any industrial project. It impacts everything from product longevity and safety to the bottom line. As the Global Business Director at MFY, I've seen firsthand how a methodical approach to material selection can be a game-changer. The stainless steel grade chart is the foundation of this process. Let's explore how to leverage this powerful tool, step by step, to ensure you make the right choice every time.
Why is Understanding the Purpose of a Grade Chart So Important?
Do you see a grade chart as just a technical data list? This common misconception leads to poor material choices. Understanding its purpose as a strategic tool unlocks optimal performance and cost-efficiency.
Understanding a grade chart's purpose is crucial because it transforms the chart from a simple reference list into a strategic decision-making tool, enabling you to balance performance, cost, and project requirements effectively.

A stainless steel grade chart is far more than a static document; it’s a dynamic framework for making informed, strategic decisions. In my role, I advise clients to view it not just as a list of chemical compositions and mechanical properties, but as a map that connects material science to business outcomes. It’s a tool for balancing performance attributes with economic realities. For instance, you might not need the highest level of corrosion resistance for an indoor architectural feature, so opting for a more economical grade like 430 instead of 316L could yield significant cost savings without compromising the project's integrity. This is where the chart’s true value lies: it empowers engineers, procurement managers, and project leaders to have a structured conversation about trade-offs. It allows you to align a material's specific capabilities with your application's demands, minimizing risk and maximizing product lifespan.
From Data to Decision
The chart facilitates a shift from simply picking a material to strategically selecting one. It helps answer critical questions like, "What level of performance is absolutely necessary, and what is 'nice to have'?" This strategic foresight is a core part of MFY’s philosophy of agility and continuous evolution.
A Simple Comparison
Consider the difference between two common austenitic grades[^1]:
| Grade | Key Feature | Common Use Case | Relative Cost |
|---|---|---|---|
| 304 | General-purpose corrosion resistance | Kitchen sinks, food equipment | Baseline |
| 316 | Enhanced corrosion resistance (due to Molybdenum) | Marine environments, chemical processing | Higher |
This simple comparison, derived directly from a grade chart, immediately clarifies the cost-performance relationship and guides a more strategic selection.
How Do You Identify the Key Properties for Your Application?
Unsure which properties matter most for your project? Guessing can lead to over-specifying or, worse, material failure. Systematically defining your needs ensures you choose a grade that performs perfectly.
Identify key properties by analyzing your application's environment (corrosion), mechanical demands (strength, ductility), fabrication process (weldability), and temperature exposure. This creates a clear checklist for your material requirements.
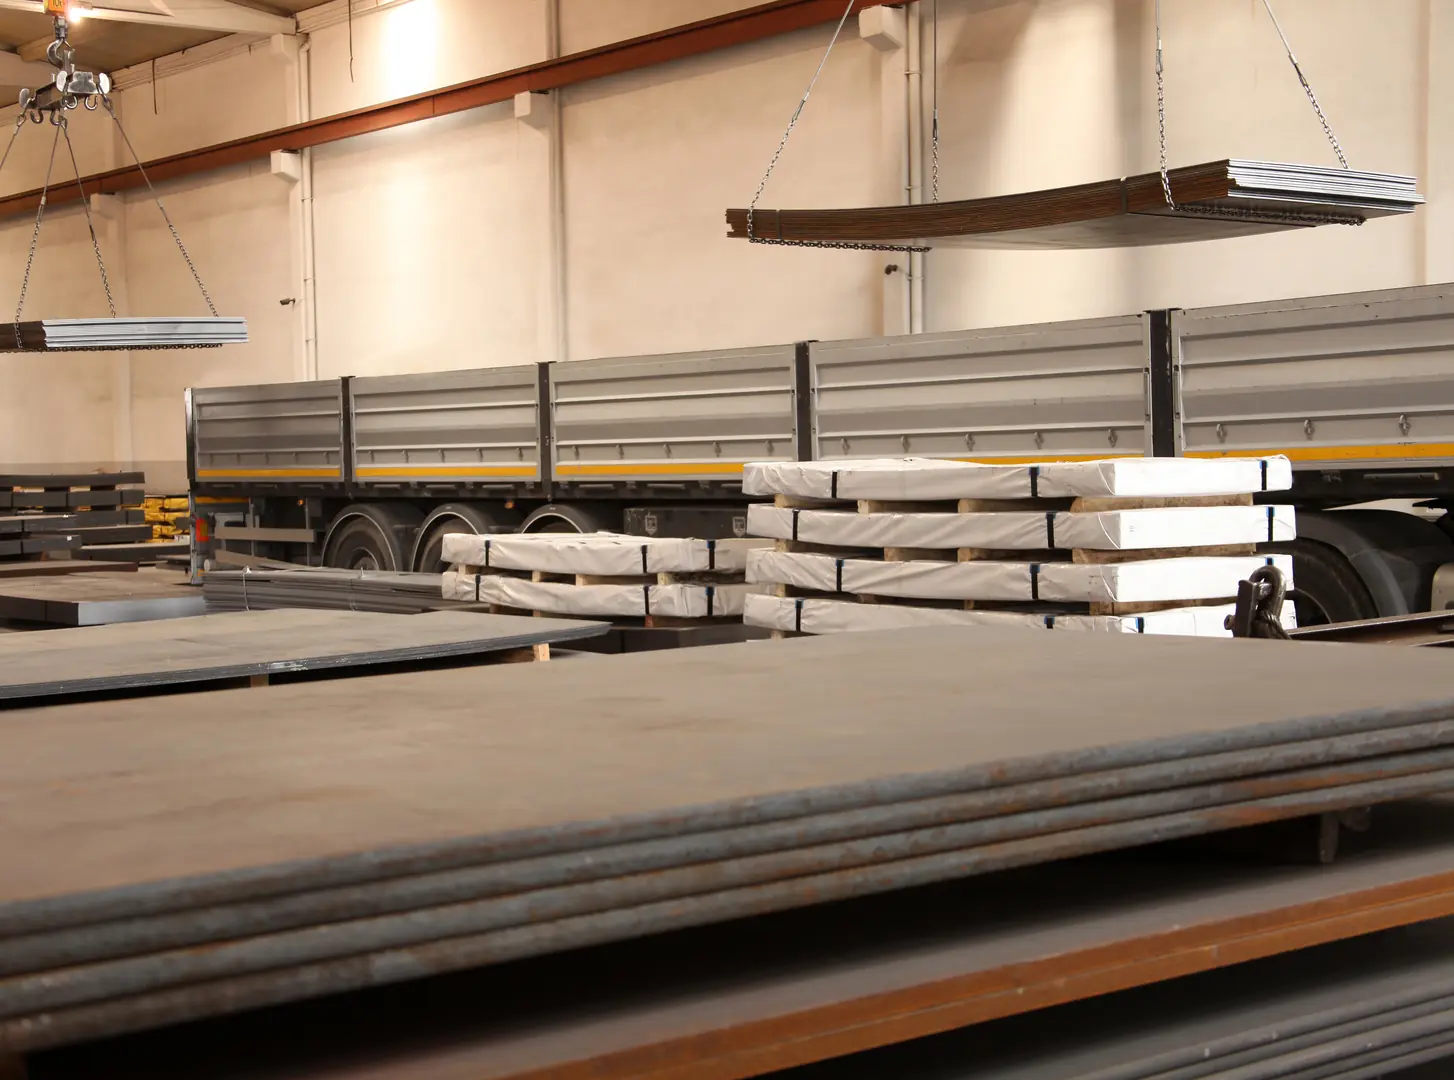
Before you even look at a chart, you must first look at your project. A deep analysis of the application's demands is non-negotiable. I remember a client in the food processing industry in India who was about to select a standard 304 grade for new tanks to save on initial costs. They hadn't fully considered the aggressive, high-chloride cleaning agents their sanitation protocols required. During our consultation, we highlighted this critical environmental factor. A quick review of the grade chart showed that 316L, with its added molybdenum content, offered far superior resistance to chloride pitting[^2]. The slightly higher upfront investment prevented what would have been certain contamination and costly equipment failure down the line. This story perfectly illustrates the importance of a thorough needs analysis. You must define your operational reality first.
Key Properties to Define
To guide this process, focus on these four critical areas:
- H3: Corrosion Resistance: What corrosive agents will the steel be exposed to? (e.g., saltwater, acids, chlorides). What is the concentration and temperature?
- H3: Mechanical Properties: What are the load-bearing requirements? Do you need high tensile strength, yield strength, or hardness? Is ductility important for forming operations?
- H3: Fabrication & Weldability: Will the material be heavily welded, machined, or formed? Some grades are much easier to work with than others, which impacts production costs.
- H3: Temperature Resistance: Will the material be exposed to extreme high or low temperatures? This will determine if you need a grade with good oxidation resistance or one that retains toughness at cryogenic temperatures.
Creating a simple checklist based on these questions will give you a clear profile of the ideal material for your needs.
How Can You Locate and Interpret the Right Grade on the Chart?
Are you overwhelmed by the dense data on a grade chart? Misinterpreting symbols or values can be a costly mistake. Learning to read the chart correctly is the key to unlocking its power.
Locate a grade by finding its designation (e.g., 304, 316L, 2205). Interpret it by cross-referencing rows and columns for chemical composition (Cr, Ni, Mo) and mechanical properties (tensile strength, yield strength).

Once you have your list of required properties, the grade chart becomes your primary reference. At first glance, it can look like an intimidating wall of numbers. But with a little practice, it becomes easy to navigate. The chart is typically organized with grade designations in the first column, followed by columns detailing their chemical and mechanical properties. The key is to map the properties you identified in the previous step to the data presented in the chart. For example, if your primary requirement is corrosion resistance in a marine environment, your eyes should immediately scan for grades with significant Molybdenum (Mo) content, like 316/316L or duplex grades. If high strength is the priority, you would focus on the columns for Tensile Strength[^3] and Yield Strength[^4].
Decoding the Data
Let's break down a typical row for a common grade to see how it works.
| Grade | C (max %) | Cr (%) | Ni (%) | Mo (%) | Tensile Strength (MPa, min) | Yield Strength (MPa, min) |
|---|---|---|---|---|---|---|
| 316L | 0.03 | 16.0-18.0 | 10.0-14.0 | 2.0-3.0 | 485 | 170 |
- H3: Chemical Composition (Cr, Ni, Mo): These elements are the building blocks that define the grade's core characteristics. Chromium (Cr) provides basic corrosion resistance, Nickel (Ni) enhances formability and ductility, and Molybdenum (Mo) boosts resistance to chlorides.
- H3: Mechanical Properties (Strength): Tensile strength tells you the maximum stress the material can withstand before breaking, while yield strength indicates the point at which it begins to deform permanently. This data is critical for any structural or load-bearing application.
By understanding what these columns represent, you can quickly filter out unsuitable grades and zero in on the most promising candidates.
What is the Best Way to Compare Different Grades?
Are you stuck between two or three similar-looking grades? Choosing based on price alone is a common and often costly mistake. A structured comparison ensures you select for best long-term value.
The best way to compare grades is to create a decision matrix. List your key properties and project priorities (e.g., corrosion resistance, cost, strength) and score each potential grade against them.

After narrowing your options down to a few potential candidates, the next step is a direct, head-to-head comparison. This is where you must rigorously balance performance with economic considerations. A simple pro-and-con list is good, but a more structured decision matrix is better. This approach forces you to weigh your priorities and score each option objectively, moving you away from a purely gut-feel decision. At MFY, we often help our clients build these matrices because it provides incredible clarity and justifies the final selection to all stakeholders. It’s a foundational element of strategic procurement. For instance, you might have to decide between the excellent corrosion resistance of a super-austenitic grade and the high strength-to-weight ratio of a duplex grade. Which is more important for your specific project?
Creating a Decision Matrix
The matrix quantifies the trade-offs. You assign a weight to each of your criteria (e.g., Corrosion Resistance might be weighted 5/5, while Weldability is 3/5). Then you score each candidate grade.
| Criterion (Weight) | Grade 304 (Score) | Grade 316L (Score) | Grade 2205 (Score) |
|---|---|---|---|
| Cost (5/5) | 5 | 3 | 2 |
| Corrosion (3/5) | 2 | 4 | 5 |
| Strength (2/5) | 3 | 3 | 5 |
| Total Score | 46 | 44 | 45 |
Note: Example scores (1-5 scale) and weights. (Total = Sum of Weight x Score)
In this hypothetical scenario, even though 316L has better corrosion resistance and 2205 has superior strength, the general-purpose Grade 304 wins out because of its strong performance on the most heavily weighted criterion: cost. This analytical approach ensures the final choice is logical, defensible, and aligned with your project's core objectives.
How Do You Make the Final, Informed Decision?
Feeling the pressure of making the final call? Indecision can delay projects and inflate costs. A confident decision comes from a thorough process and validating your choice with trusted experts.
Make the final decision by selecting the grade that best satisfies your prioritized criteria from the comparison stage. Always validate your choice with a trusted supplier to account for market availability and cost fluctuations.

You have analyzed your needs, interpreted the chart, and compared your top candidates. Now it's time to make the final selection. The decision matrix should point you to a clear winner based on your weighted criteria. However, the process doesn't end there. The grade chart is a technical tool, but the market is a dynamic environment. The 'best' grade on paper is useless if it's not readily available or if its price is prohibitively volatile. This is the final, critical step: validation. You must consult with a knowledgeable and reliable supplier who can provide insight into real-world factors.
Beyond the Chart: Supply Chain Factors
This is where a partnership with a company like MFY becomes invaluable. We don't just supply steel; we provide market intelligence. We can confirm current pricing, lead times, and the availability of specific grades and forms (plate, coil, pipe). We see the grade chart not as a static reference but as a tool that must be interpreted in the context of an ever-evolving global supply chain. This perspective reflects our core values of agility and resilience.
Partnering for Success
Making the informed decision means integrating the technical data from the chart with practical, on-the-ground supply chain realities. Your final choice should be a synthesis of:
- Technical Suitability: The grade meets all your performance requirements.
- Economic Viability: The cost aligns with your project budget.
- Market Availability: The material is procurable within your project timeline.
By following this comprehensive process and validating your choice with an expert partner, you can be confident that you are not just buying a stainless steel plate—you are making a strategic investment in the success and longevity of your project.
Conclusion
A stainless steel grade chart is your strategic guide to material selection. By understanding its purpose, defining your needs, comparing options methodically, and consulting experts for validation, you can confidently choose the right grade, ensuring project success and optimizing long-term value for your investment.
Have Questions or Need More Information?
Get in touch with us for personalized assistance and expert advice.
